
In a recent study published in the journal Nature Biotechnology, researchers introduced deep visual proteomics (DVP), an amalgamation of artificial intelligence (AI) for image analysis and mass spectrometry (MS) for proteomic profiling of biological samples.
Existing proteomic analysis techniques are limited in their ability to image tissues at single-cell resolution and usually target a pre-defined protein subset, which is much smaller than the actual complex proteomic profile of cells and tissues.
Study: Deep Visual Proteomics defines single-cell identity and heterogeneity. Image Credit: Nature Biotechnology (Nat Biotechnol) – Creative Commons Attribution 4.0 International License
About the study
Researchers in this study reported that single-cell, sub-cellular proteome analysis with DVP is a novel approach for proteomic analysis.
Archived patient tissue samples were scanned using high-resolution microscopy and segmented using AI- and deep learning (DL)-based methods to enable the identification of cellular phenotypes by machine learning (ML) algorithms.
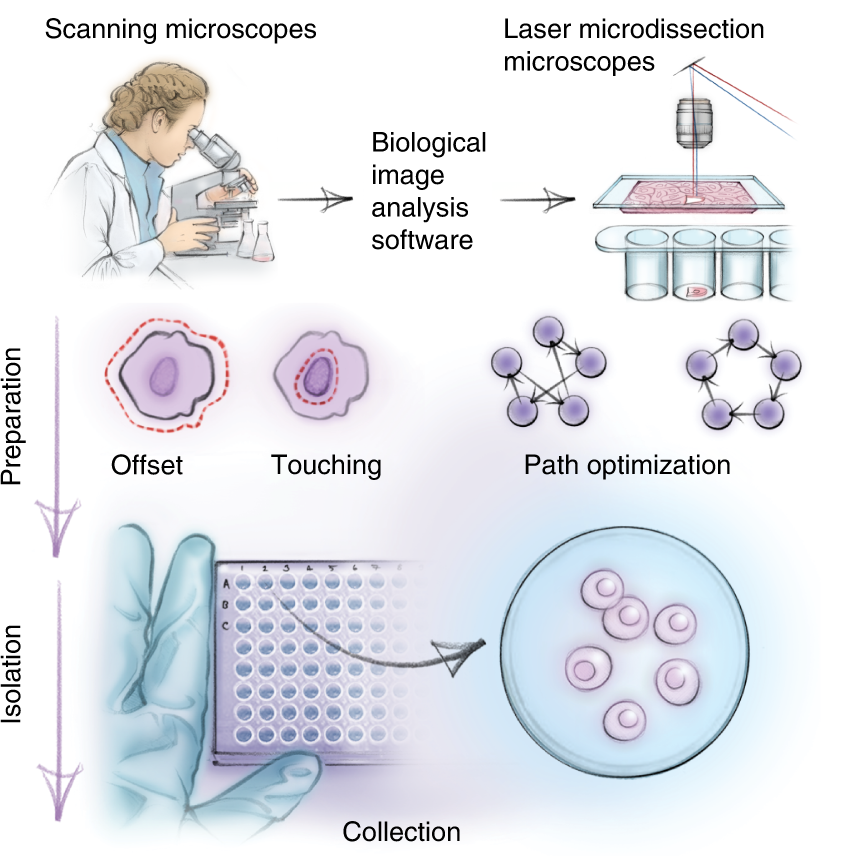
Further, whole samples were subjected to laser microdissection (LMD) to obtain single-cell isolates. The protein profiles of individual cells were assessed using ultra-sensitive MS analysis and bioinformatics tools. The images were analyzed using the biological image analysis software (BIAS). Bioinformatic tools were used to enable data mining for determining protein signatures.
The ML-based phenotypic classification was combined with proteomic expression levels from immunofluorescence and immunohistochemistry (IHC) antibody staining for precise cell classification. Melanoma samples, salivary acinic cell carcinoma samples, and the human fallopian tube epithelial tissue samples were examined.
The human fallopian tube samples and salivary malignancy samples were immunostained for detection of EpCAM (epithelial cellular adhesion molecule) antibodies and FOXJ1 (forkhead box J1) antibodies, respectively. Melanoma samples were stained for the assessment of their CD146 ((cluster of differentiation 146) and SOX10 (SRY-box transcription factor 10) expression.
In addition, deoxyribonucleic acid (DNA)-stained fluorescent ubiquitination-based cell cycle indicator (FUCCI) U2OS cell lines were analyzed to differentiate between normal and malignant cells by DVP. Principal component analysis (PCA) and gene set pathway enrichment analysis of the IHC-identified cell proteomes were performed. Proteomic profiles of the tissues were assessed using heat maps and volcano plots based on the human protein atlas (HPA) project. For MS analysis, we employed a data-independent acquisition method using parallel accumulation–serial fragmentation (diaPASEF) was used.
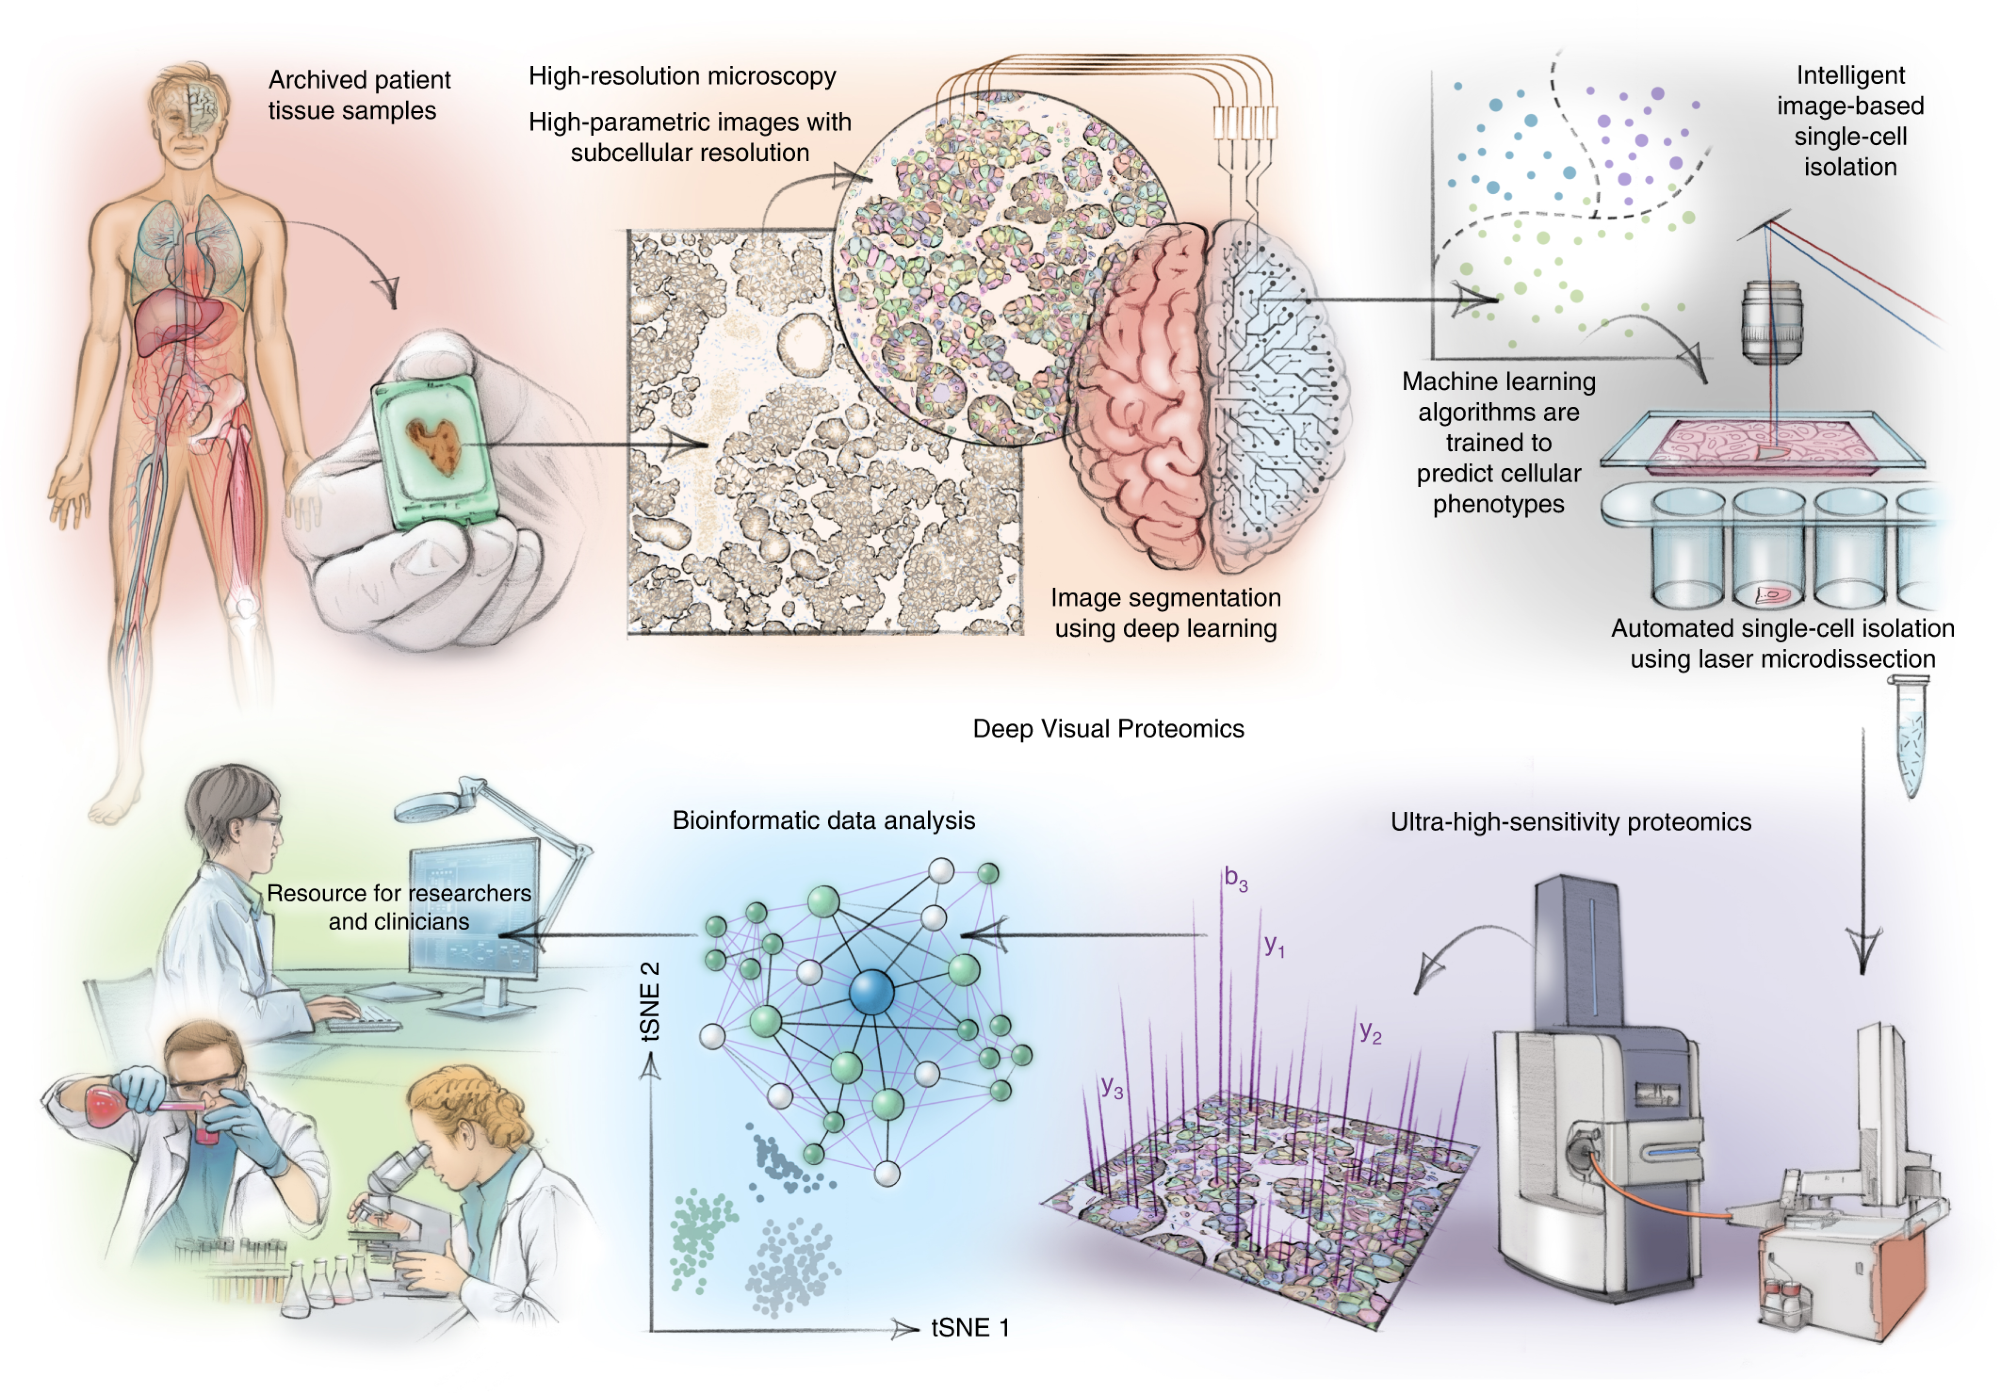 DVP combines high-resolution imaging, AI-guided image analysis for single-cell classification and isolation with an ultra-sensitive proteomics workflow. DVP links data-rich imaging of cell culture or archived patient biobank tissues with deep-learning-based cell segmentation and machine-learning-based identification of cell types and states. (Un)supervised AI-classified cellular or subcellular objects of interest undergo automated LMD and MS-based proteomic profiling. Subsequent bioinformatics data analysis enables data mining to discover protein signatures, providing molecular insights into proteome variation in health and disease states at the level of single cells. tSNE, t-distributed stochastic neighbor embedding.
Results
After data filtering, 3,653 protein groups were identified, of which 515 proteins were significantly enriched. DVP yielded 80 to 100 single cells and 250 to 300 nuclei for every cellular phenotype. LMD autonomously excised 1,250 high-resolution cell contours every hour, equivalent to 50 to 100 cells of every sample, with 200 nm accuracy.
Cellular and nuclear proteomic replicates demonstrated high quantitative reproducibility (Pearson correlation coefficient r=0.96), indicative of DVP reproducibility. Six distinct U2OS nuclei classes were identified based on the cellular morphological features (nuclear area, solidity, perimeter, and form factor), cellular phenotypes, and DNA-based staining. The classes represented various stages of the cell cycle.
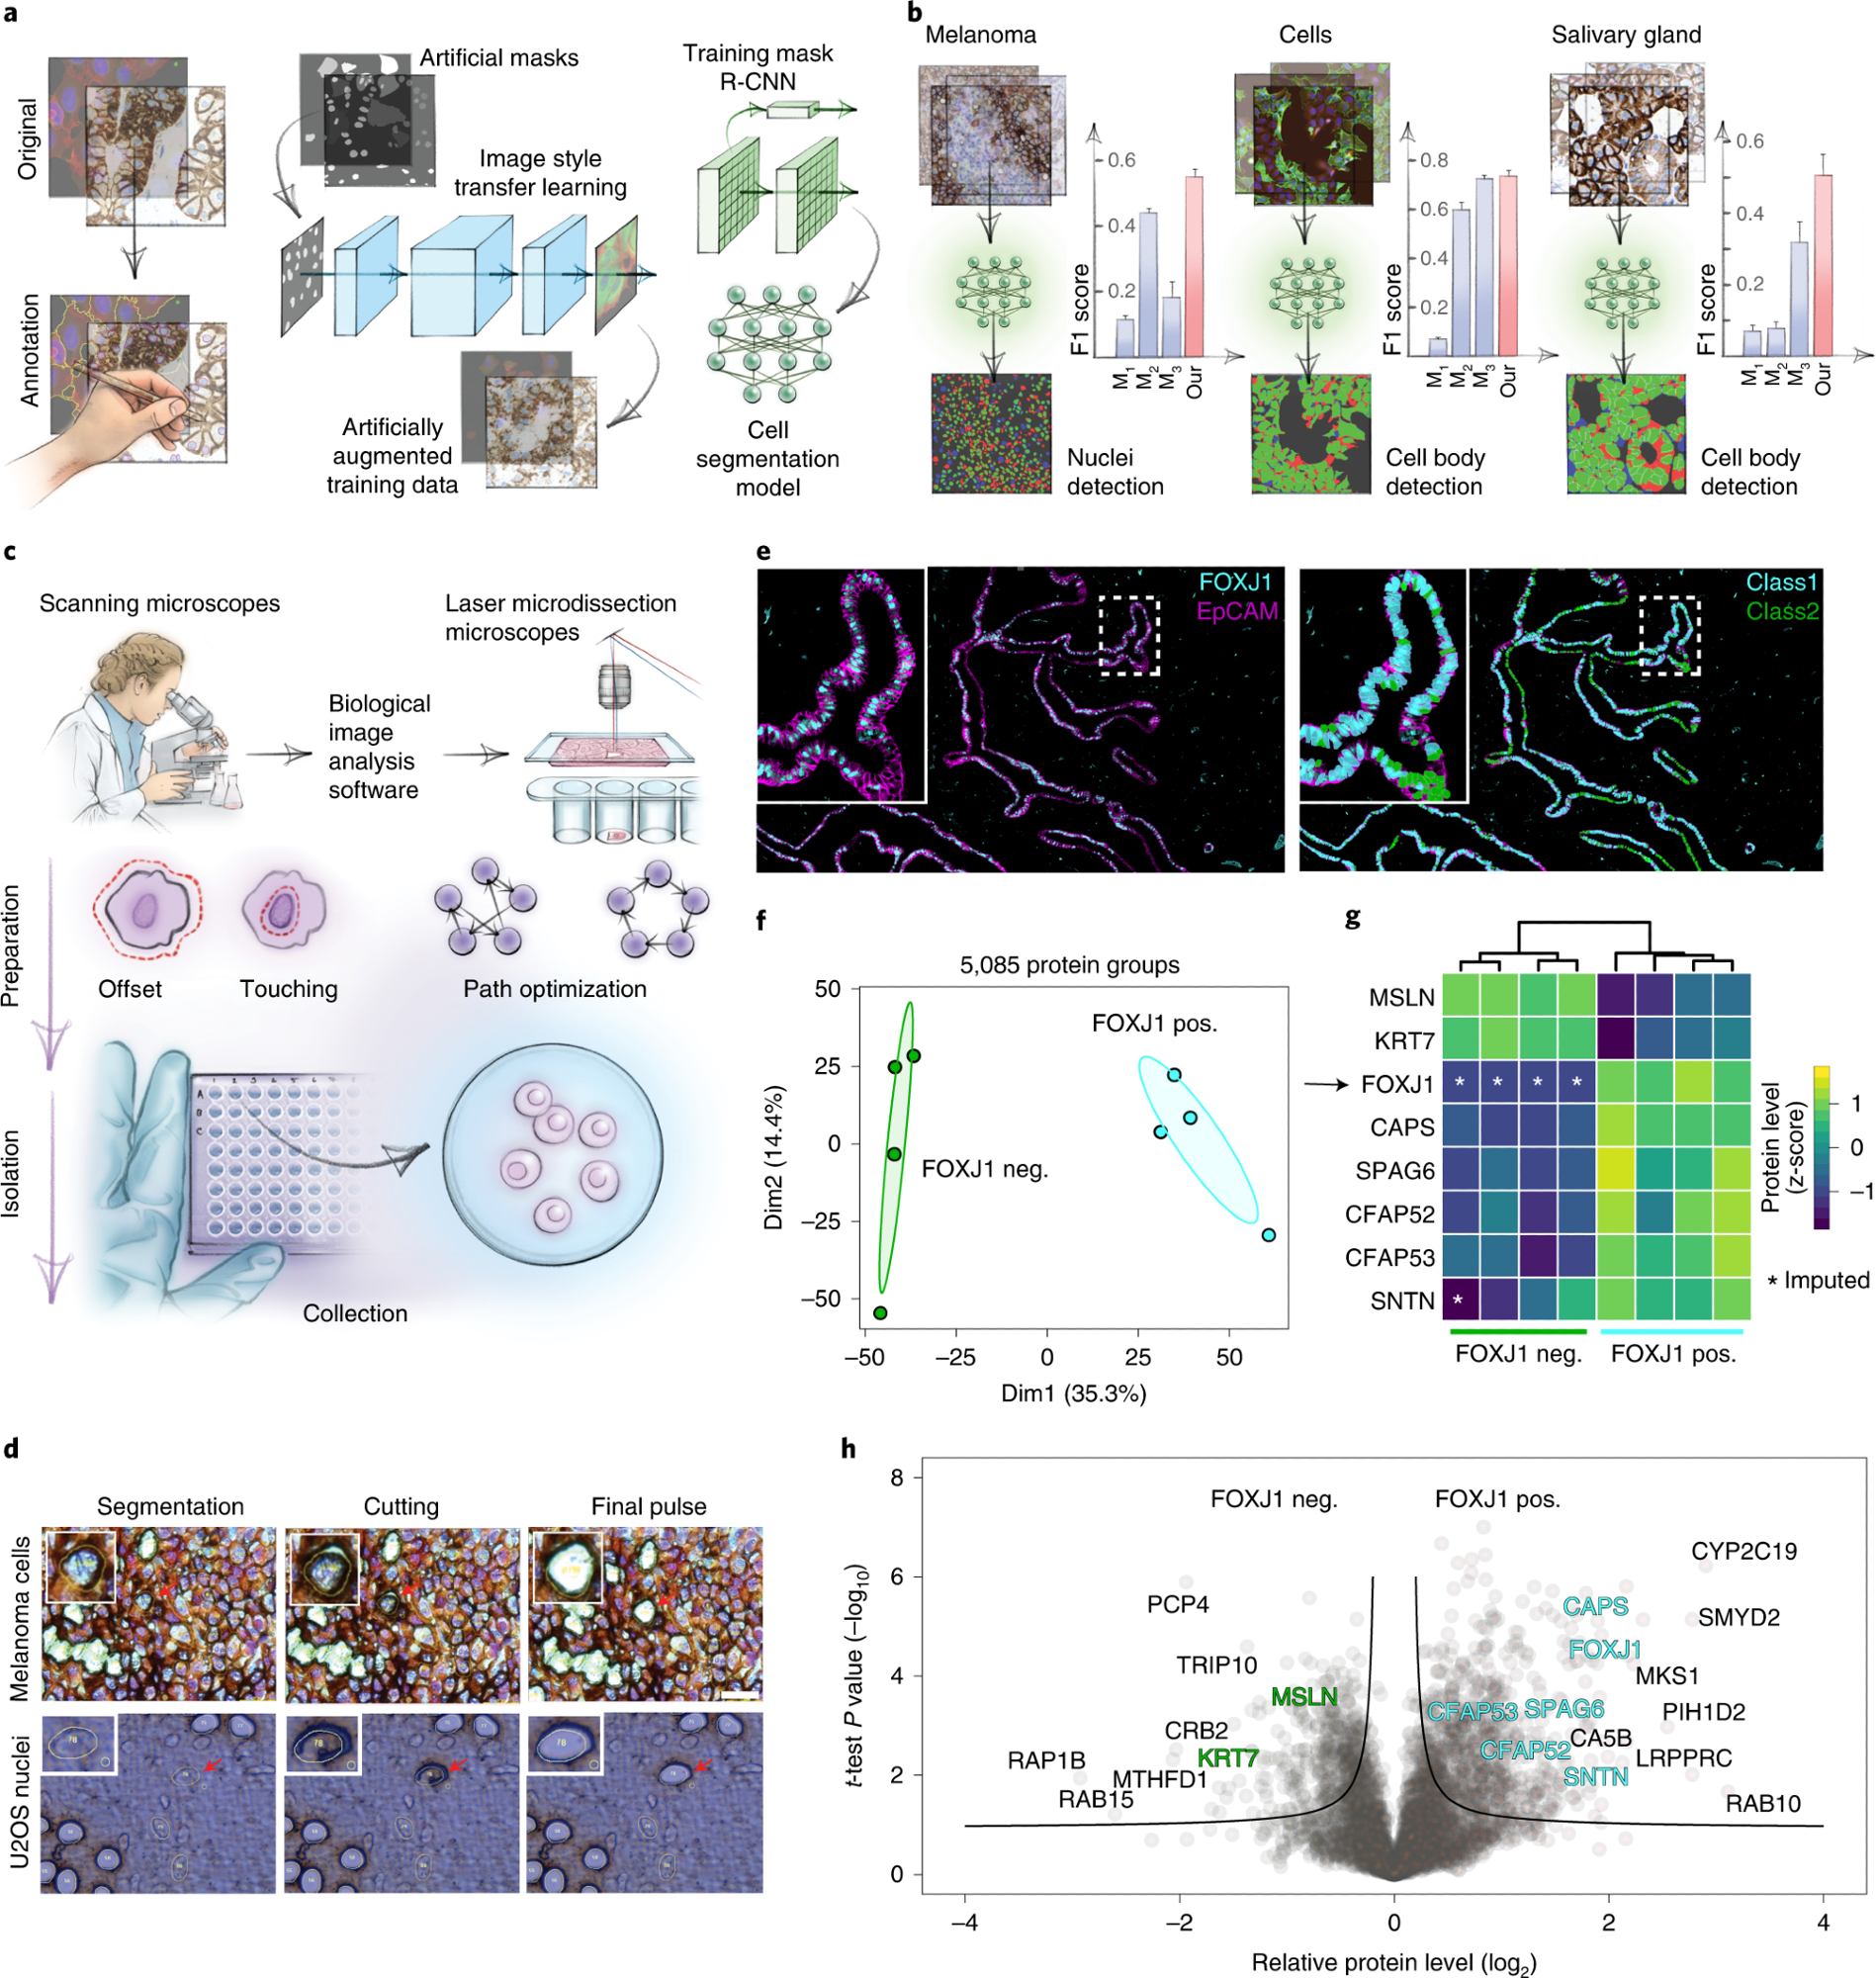 a, AI-driven nucleus and cytoplasm segmentation of normal-appearing and cancer cells and tissue using BIAS. b, We benchmarked the accuracy of its segmentation approach using the F1 metric and compared results to three additional methods—M1 is unet4nuclei6, M2 is CellProfiler8 and M3 is Cellpose7—while OUR refers to nucleAIzer3. Bars show mean F1 scores with s.e.m.; n = 10 independent images for melanoma tissue and (U2OS) cells, and n = 20 for salivary gland tissue. Visual representation of the segmentation results: green areas correspond to true positive, blue to false positive and red to false negative. c, BIAS serves as the interface between the scanning and an LMD microscope, allowing high-accuracy transfers of cell contours between the microscopes. Illustration of cutting offset with respect to the object of interest and optimal path finding. d, Practical illustration of the functions in the upper panel. e, Immunofluorescence staining of the human fallopian tube epithelium with FOXJ1 and EpCAM antibodies, detecting ciliated and epithelial cells, respectively. Left panel: Ciliated (FOXJ1-positive) and secretory (FOXJ1-negative) cells. Right panel: Cell classification based on FOXJ1 intensity. Class 1 (FOXJ1-positive) and class 2 (FOXJ1-negative); magnification factor = ×387. f, PCA of FOXJ1-positive and FOXJ1-negative cell proteomes. g, Heat map of known protein markers for secretory and ciliated cells. Protein levels are z-scored. Asterisks represent imputed data. The marker list was derived from the Human Protein Atlas20 project and based on literature mining. h, Volcano plot of the pairwise proteomic comparison between FOXJ1-positive and FOXJ1-negative cells. Cell-type-specific marker proteins are highlighted in green and turquoise, and black represents potential novel marker proteins. Significant enriched cell-type-specific proteins are displayed above the black lines (two-sided t-test, FDR < 0.05, s0 = 0.1, n = 4 biological replicates
Furthermore, the single-cell-type proteomic analysis revealed several uncharacterized class-specific proteins such as C7orf50 (chromosome 7 open reading frame 50), C11orf98 (chromosome 11 open reading frame 98), C19orf53 (chromosome 19 open reading frame 53), and C1orf112 (chromosome 1 open reading frame 112) with increased C7orf50 expression in the nucleoli of nucleic classes 2, 3, and 4. Since the classes represented cell-cycle changes, the class-specific proteins could be used as potential biomarkers of the different stages of the cell cycle.
In the IHC analysis, the fallopian tube ciliated cells were FOXJ1-positive and whereas the secretory cells were FOXJ1-negative. While normal salivary gland cells were EpCAM negative, the malignant salivary acinar cells demonstrated positive EpCAM expression. In addition, normal salivary regions mainly comprised acinar, ductal, and myoepithelial cells, whereas the malignant regions demonstrated cells abundant basophilic cytoplasm and round nuclei.
Melanoma tissues were as normal stromal cells, melanocytes, melanoma in situ, low CD146 expressing-low melanoma, high CD146-expressing melanoma, non-invasive/radial growth melanoma, and invasive/vertical growth melanoma.
Additionally, normal tissues demonstrated higher expression of AMY1A (alpha-amylase 1), CA6 (carbonic anhydrase VI), and PIP (prolactin-induced protein) proteomic markers, whereas malignant tissues demonstrated increased non-receptor tyrosine kinase (SRC) proto-oncogene and increased messenger ribonucleic acid (mRNA) splicing coupled with reduced interferon (IFN) signaling protein expression.
Overall, the study findings showed that DVP is a valuable tool for precise, ultra-sensitive, and reproducible detection of malignancies in their initial stages based on the changes in their cellular proteomic profiles and phenotype estimation. The single-cell proteomic alterations detected with sub-cellular resolution could be used as biomarkers to differentiate between health and disease and therapeutic targets. The protein signatures identified by DVP could provide valuable insights into the molecular alterations in disease states.
- Mund, A., Coscia, F., Kriston, A. et al. Deep Visual Proteomics defines single-cell identity and heterogeneity. Nat Biotechnol (2022). https://doi.org/10.1038/s41587-022-01302-5, DOI: https://doi.org/10.1038/s41587-022-01302-5, https://www.nature.com/articles/s41587-022-01302-5
Posted in: Device / Technology News | Medical Science News | Medical Research News
Tags: Antibodies, Antibody, Artificial Intelligence, Bioinformatics, Biotechnology, Cancer, Cancer diagnostics, Carcinoma, Cell, Cell Culture, Cell Cycle, Chromosome, Chromosome 1, Chromosome 11, Chromosome 19, Chromosome 7, Cytoplasm, Deep Learning, Diagnostics, DNA, Fallopian Tube, Gene, Genome, heat, IHC, Imaging, Immunohistochemistry, Interferon, Kinase, Machine Learning, Magnification, Malignant, Mass Spectrometry, Melanoma, Microscope, Microscopy, Molecule, Oncogene, Phenotype, Prolactin, Protein, Protein Expression, Proteome, Proteomics, Receptor, Ribonucleic Acid, Salivary Gland, Spectrometry, Splicing, Transcription, Tyrosine

Written by
Pooja Toshniwal Paharia
Dr. based clinical-radiological diagnosis and management of oral lesions and conditions and associated maxillofacial disorders.
Source: Read Full Article