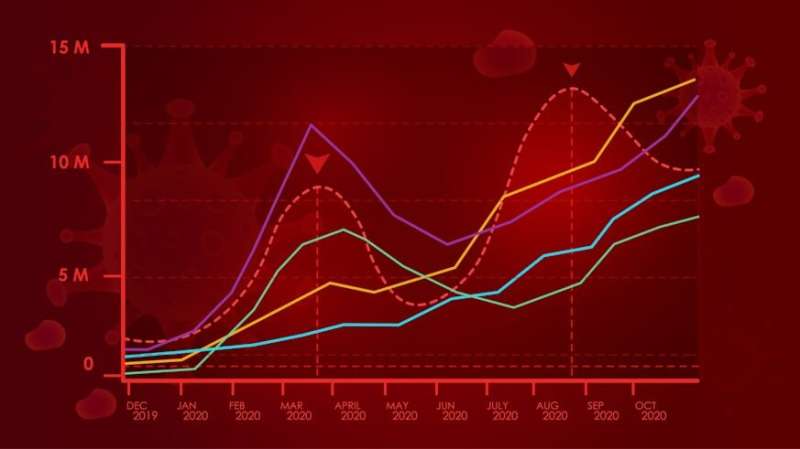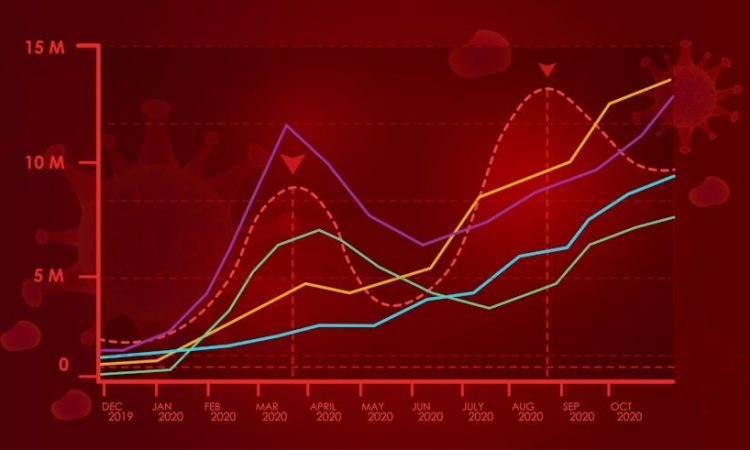
A method for defining different waves of COVID-19 to better understand the progression of the virus across the pandemic has been devised by a team of scientists at Cardiff University and the University of Oxford. They developed an algorithm that identifies substantial, significant, and sustained periods of increase, described as “observed waves,” when applied to daily cases and fatalities of COVID-19.
Their study, published in Heliyon, addresses the lack of set criteria to define each wave of coronavirus despite extensive scrutiny of pandemic data and frequent discussion of waves in media coverage and public life.
Dr. Adam Mahdi, founder of the University of Oxford’s OxCOVID19 project, said, “Our algorithmic approach offers a tangible means to identify and understand observed waves of disease.
“By revealing the types, drivers, and modulators of COVID-19 waves, our research contributes to the broader analysis of the epidemic’s progression.”
Co-author Professor Ricardo Aguas from the Nuffield Department of Medicine at the University of Oxford added, “Applying an algorithm to a spectrum of time series data can help address relevant epidemiological questions: How can we best define an epidemiological wave? Intuitively, anyone would guess that a series of rising and falling cases would make a wave. However, by how much does it need to rise and drop for it to be epidemiologically meaningful?”
Periods of higher infection were identified as meaningful waves of the disease rather than more temporary fluctuations if they were sufficiently long and sufficiently severe. Dips between waves were ignored unless the case rate fell below a certain threshold of the peak value.
The algorithm provides a tool for policymakers and public health experts to better comprehend and respond to the dynamics of future epidemics and pandemics. With the ability to uniformly describe and analyze observed waves, decision-makers can refine their strategies and interventions, aiming for a more effective and targeted approach to disease management.
Co-author Dr. John Harvey, a UK Research and Innovation (UKRI) Future Leaders Fellow at Cardiff University, observes that proposing uniform definitions for concepts that cannot be easily defined is a commonly used scientific technique, drawing a similarity with body weight measurement.
He said, “Nobody would claim that a person magically becomes underweight the moment their BMI goes below 18.5—there is nothing special about this particular number and every individual is different. But drawing a line somewhere—anywhere—makes it possible to study the effects of being underweight.
“We can do the same exercise with a wave. Once something has a definition, you can start to investigate and understand it.”
The researchers employed their algorithm to synthesize COVID-19 data across different countries, adopting a wave-centric view.
The analysis of individual countries revealed significant variations in consecutive observed waves, particularly in terms of the case fatality ratio.
A more detailed examination revealed diverse geographical ranges for consecutive observed waves, especially in larger countries.
The study also confirmed the impact of government interventions on modulating these waves, with early implementation of non-pharmaceutical interventions found to correlate with a reduced number of observed waves and a decreased mortality burden during those waves.
More information:
John Harvey et al, Epidemiological waves—Types, drivers and modulators in the COVID-19 pandemic, Heliyon (2023). DOI: 10.1016/j.heliyon.2023.e16015
Journal information:
Heliyon
Source: Read Full Article
