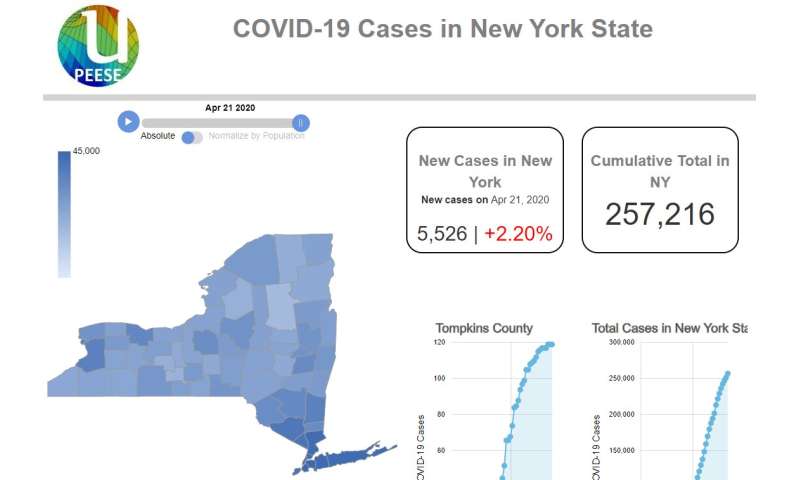
A website developed by a Cornell team offers insight into the rate of coronavirus infections across New York state over days, charting daily and cumulative totals of new cases to help users see whether they’re flattening the curve.
The site, updated daily with d … the state’s counties, provides easy-to-use interactive visualizations depicting the virus’ spread or slowdown by county or statewide.
“When we had to shut down our lab, we wanted to see what we could do with our expertise in systems engineering to help the public and provide timely information,” said Fengqi You, the Roxanne E. and Michael J. Zak Professor in Energy Systems Engineering, who is leading the effort. “We’re viewing this as a citizen science project, but one where accuracy and primary data are paramount.”
The site includes a play button and a slider where users can watch how infections spread day by day across New York state, as well as interactive charts offering different ways of viewing the outbreak statewide or by county. Users can view the total number of new infections by county, as well as a chart showing the numbers of infections per 100,000 residents for each county since the first COVID-19 case was reported in New York state on March 2.
“We wanted to make sure the website was readable and of interest to the public,” You said. “Visualization is a useful and powerful tool.”
When he began the project in March, You reached out to the researchers in his lab and the students in his Industrial Big Data Analytics and Machine Learning class—as well as colleagues in the College of Engineering, Computing and Information Science and the College of Veterinary Medicine (CVM) – to see who wanted to help.
He quickly assembled a team of students to help both with compiling data and building a nimble and accessible website, as well as experts in other fields to help determine which data points to use and how to visualize them. He collaborated with Joe Guinness, assistant professor of statistics and data science, about data collection, Daryl Nydam, professor in CVM and faculty director of the Cornell Atkinson Center for Sustainability, and Renata Ivanek, Ph.D. ’08, associate professor in CVM, on the overall cyberinfrastructure idea and design of the website.
What emerged was a cross-college radical collaboration comprising students and faculty eager to contribute to the public good. The project is being supported by Cornell’s Office of Engagement Initiatives and Cornell Atkinson, where You is a fellow.
“Even students who are home—some in California, some in Texas—are still Cornell students, and they still care about New York,” You said. “We all feel like we have a mission to help with this crisis.”
At first, students collected the data manually from county health departments—a complicated process because each county posted the numbers of daily infections in different formats and at different times of day. Now, the process is automated, though students still manually check the numbers.
“We need to make sure the data are correct and consistent,” You said.
Source: Read Full Article
