
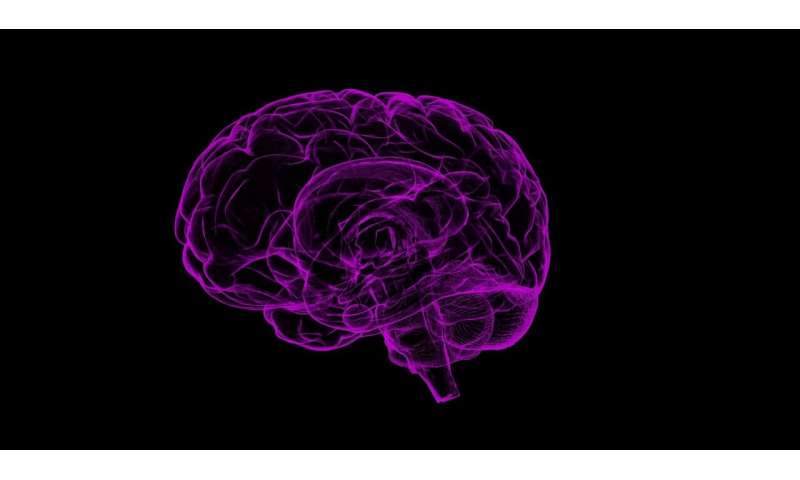
This colorful brain scan is a 3-D model created by tractography, which uses data collected with diffusion weighted MRI to map the brain’s white matter. Each line represents a bundle of nerve fibers wrapped in a myelin sheaths, which insulate the fibers thereby speeding up the rate of communication between brain regions.
The colors aren’t just for show. Each color represents a different direction of the fibers.
- Red indicates directions in the X axis: right to left or vice versa.
- Green indicates directions in the Y axis: front to back or vice versa.
- Blue indicates directions in the Z axis: foot-to-head direction or vice versa.
- The other colors indicate fibers that are crossing in different directions.
Neuroscientists are using tractography to better understand a range of disorders including depression, schizophrenia, and traumatic brain injury. Duke professor Ahmad Hariri uses tractography and other neuroimaging measures in the search for biological pathways mediating individual differences in behavior and related risk for psychiatric and neurological disorders.
https://youtube.com/watch?v=yueP3lsoEm0%3Fcolor%3Dwhite
Source: Read Full Article